In the world of event management, data is power. Whether you’re running a local concert, a business seminar, or a recurring festival, understanding your event’s performance can make or break your success. That’s exactly why ME-Ticket developed its Analytics Dashboard — a powerful tool that helps organizers track performance, optimize ticket sales, and create even better events.

A Smarter Way to Understand Your Event’s Success
The Statistics Dashboard inside your ME-Ticket organizer account isn’t just a collection of charts and numbers — it’s your event’s personal report card. Every ticket sold, every view, every refund — it’s all captured and visualized so you can see how your efforts translate into real results.
Instead of guessing which event performed best or which pricing strategy worked, the dashboard lets you see the full picture in one place. Think of it as your event’s health monitor, giving you a pulse on what’s working and what needs a little attention.Key Metrics That Matter
The ME-Ticket Analytics Dashboard was built with event professionals in mind. It’s simple, clean, and focused on the most important performance metrics. Let’s break down what you can track:
1. Ticket Sales Summary
This section shows you the total revenue from ticket sales for your chosen event or date range. Want to know how this month compares to last month? Or how your summer concert series performed compared to the previous year? You can filter the data to get an instant comparison.
The Sales Chart displays trends over time — whether you’re tracking daily, monthly, or yearly performance. Spikes in ticket sales might indicate when your marketing campaigns hit the mark or when fans were most active.
2. Event Views
Views tell you how often your event page was visited on ME-Ticket. A high number of views means great visibility — but if sales don’t match up, it’s a signal to tweak your messaging or visuals. The Views Summary and Views Chart provide a quick look at your reach and engagement.
You can even monitor the popularity of different events if you have several running at once. For instance, if your jazz concert is getting more attention than your comedy night, you can adjust your promotional focus accordingly.
3. Ticket Type Sales
Not all tickets are created equal — and ME-Ticket knows that. Whether you offer VIP access, early bird discounts, or general admission, the dashboard’s Ticket Type Sales section breaks it all down for you.
Color-coded charts help you see which ticket categories sell out fastest and which need a little push. For example, if your VIP section is underperforming, you might consider adding exclusive perks or adjusting pricing.
4. Ticket Returns
Refunds happen — but understanding why they happen helps you prevent future losses. The dashboard includes a Ticket Returns indicator, showing how many tickets were refunded during your selected timeframe. This helps you identify potential issues, such as schedule conflicts, unclear event details, or logistical problems.
5. Average Ticket Price
Your pricing strategy is one of the biggest factors in your event’s profitability. The Average Ticket Price metric reveals how your pricing trends evolve over time. It can help you understand how discounts, promotions, and different ticket tiers impact your overall revenue.Filters That Give You Full Control
The ME-Ticket Analytics Dashboard gives you powerful filters so you can dig deeper into your data.
You can filter by:
- Event Name – Focus on one event or compare several at once.
- Period of Time – Choose from predefined ranges like Last 7 Days, Last Month, or Lifetime, or set a custom date range.
With these filters, you can explore both the big picture and the small details. For example, want to know how your summer events performed over the past three months? Just select the timeframe and watch the dashboard update instantly.
And yes — if you love having offline reports, you can easily export your statistics as a CSV file for further analysis or presentation. It’s ideal for sharing with your team, investors, or sponsors.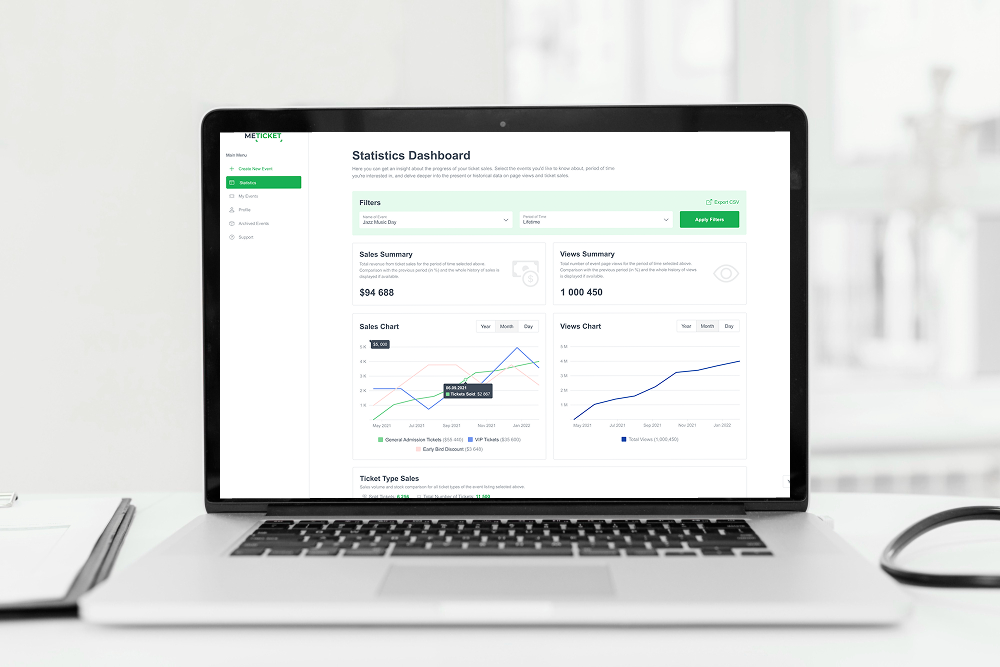
Data Visualization Made Simple
Numbers are useful, but visuals make them meaningful. The ME-Ticket dashboard uses interactive graphs and charts that transform your data into an easy-to-understand format. You can switch between yearly, monthly, or daily views depending on the level of detail you need.
Each event’s performance is represented visually:
- Sales Charts display revenue growth trends.
- Views Charts reveal engagement levels.
- Pie Charts show ticket type distributions (like General Admission, VIP, or Early Bird).
Everything is designed to help you spot trends at a glance — no data science degree required.

Real-Time Insights for Smarter Decisions
The beauty of the ME-Ticket Analytics Dashboard is that it updates in real-time. That means as soon as someone buys a ticket or views your event page, you’ll see the impact instantly.
Imagine launching a social media ad campaign and being able to track ticket sales as they happen. You’ll know exactly which promotions work best, when your audience is most active, and how your events perform over time.
Why Analytics Matter for Organizers
In event management, intuition is great — but data turns good instincts into smart strategy.
By using ME-Ticket’s Analytics Dashboard, you can:
- Optimize marketing campaigns based on actual performance.
- Understand your audience behavior, like when they’re most likely to buy.
- Forecast future sales using historical data.
- Refine pricing and ticket types for maximum revenue.
- Identify and solve issues quickly, from low sales to high refunds.
In short, ME-Ticket gives organizers not just data, but direction.
How to Access Your Statistics
Getting started is easy. Simply log into your ME-Ticket Personal Account, navigate to the Statistics tab on the left-hand menu, and dive into your dashboard. From there, you can filter, analyze, and export your event data in seconds.
Whether you’re managing one event or dozens, this dashboard keeps everything organized and actionable — helping you make decisions based on facts, not guesswork.

Final Thoughts
The ME-Ticket Analytics Dashboard is more than a feature — it’s your event’s strategic partner. It turns complex data into clear, visual insights that help you track ticket sales, measure engagement, and improve future performance.
If you’re ready to elevate your event game, start exploring your ME-Ticket analytics today. Because when you truly understand your numbers, every decision becomes smarter — and every event, more successful.


